The Executive Connection Stay connected with the latest news and insights within the Restaurant, Hospitality, Food Service, and Franchise Industries Wray Search 6/6/26 Wray Search 6/6/26 5 Hiring Mistakes CEOs Make When Recruiting a Franchise CMO Read More Kevin Stockslager, Managing Partner 5/12/26 Kevin Stockslager, Managing Partner 5/12/26 Financials - May 2026 Read More Kevin Stockslager, Managing Partner 5/12/26 Kevin Stockslager, Managing Partner 5/12/26 Executive Movements - May 2026 Read More Ray Kelley 5/12/26 Ray Kelley 5/12/26 The CFO Talent Bottleneck Read More Kevin Stockslager, Managing Partner 5/12/26 Kevin Stockslager, Managing Partner 5/12/26 Corner Office Conversations: Sherif Mityas, CEO of BRIX Holdings Read More John Gordon 5/12/26 John Gordon 5/12/26 Consumer Conditions Challenged But… Read More John Gordon 4/15/26 John Gordon 4/15/26 Restaurants: More of the Same Read More Ray Kelley 4/14/26 Ray Kelley 4/14/26 The Hidden Lever in Restaurant PE Returns: Executive Team Design Read More Kevin Stockslager, Managing Partner 4/14/26 Kevin Stockslager, Managing Partner 4/14/26 Financials - April 2026 Read More Kevin Stockslager, Managing Partner 4/14/26 Kevin Stockslager, Managing Partner 4/14/26 Executive Movements - April 2026 Read More Kevin Stockslager, Managing Partner 4/14/26 Kevin Stockslager, Managing Partner 4/14/26 Corner Office Conversations: Eric Knott, CEO of Tiki Taco Read More Wray Search 4/14/26 Wray Search 4/14/26 Wray Executive Search Welcomes Jonathan Kelley as Vice President of Recruiting Read More Wray Search 4/13/26 Wray Search 4/13/26 2026 Franchise Executive Salary Report: Compensation Trends for Operations and Development Leaders Read More Wray Search 4/8/26 Wray Search 4/8/26 Top Interview Questions to Ask Franchise Leaders (And What to Listen For) Read More Franchise, Restaurant Wray Search 4/2/26 Franchise, Restaurant Wray Search 4/2/26 Restaurant CMO vs. Franchise CMO: What's the Difference? Read More John Gordon 3/17/26 John Gordon 3/17/26 Restaurant Topline is Flat, Margin Outlook Unfavorable Read More Kevin Stockslager, Managing Partner 3/17/26 Kevin Stockslager, Managing Partner 3/17/26 Corner Office Conversations: Jennifer Dodd, CEO of Main Squeeze Juice Co. Read More Kevin Stockslager, Managing Partner 3/17/26 Kevin Stockslager, Managing Partner 3/17/26 Financials - March 2026 Read More Kevin Stockslager, Managing Partner 3/17/26 Kevin Stockslager, Managing Partner 3/17/26 Executive Movements - March 2026 Read More Mary Rombaut 3/11/26 Mary Rombaut 3/11/26 Franchise Executive Search in Dallas Texas: Finding C-Suite Leaders Who Drive Growth Read More Older Posts
Wray Search 6/6/26 Wray Search 6/6/26 5 Hiring Mistakes CEOs Make When Recruiting a Franchise CMO Read More
Kevin Stockslager, Managing Partner 5/12/26 Kevin Stockslager, Managing Partner 5/12/26 Financials - May 2026 Read More
Kevin Stockslager, Managing Partner 5/12/26 Kevin Stockslager, Managing Partner 5/12/26 Executive Movements - May 2026 Read More
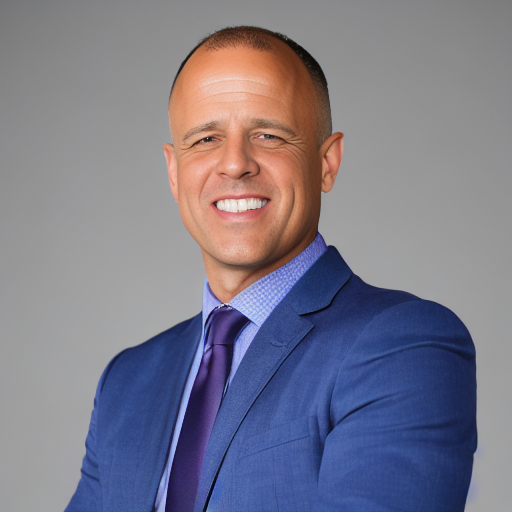
Kevin Stockslager, Managing Partner 5/12/26 Kevin Stockslager, Managing Partner 5/12/26 Corner Office Conversations: Sherif Mityas, CEO of BRIX Holdings Read More
Ray Kelley 4/14/26 Ray Kelley 4/14/26 The Hidden Lever in Restaurant PE Returns: Executive Team Design Read More
Kevin Stockslager, Managing Partner 4/14/26 Kevin Stockslager, Managing Partner 4/14/26 Financials - April 2026 Read More
Kevin Stockslager, Managing Partner 4/14/26 Kevin Stockslager, Managing Partner 4/14/26 Executive Movements - April 2026 Read More
Kevin Stockslager, Managing Partner 4/14/26 Kevin Stockslager, Managing Partner 4/14/26 Corner Office Conversations: Eric Knott, CEO of Tiki Taco Read More
Wray Search 4/14/26 Wray Search 4/14/26 Wray Executive Search Welcomes Jonathan Kelley as Vice President of Recruiting Read More
Wray Search 4/13/26 Wray Search 4/13/26 2026 Franchise Executive Salary Report: Compensation Trends for Operations and Development Leaders Read More
Wray Search 4/8/26 Wray Search 4/8/26 Top Interview Questions to Ask Franchise Leaders (And What to Listen For) Read More
Franchise, Restaurant Wray Search 4/2/26 Franchise, Restaurant Wray Search 4/2/26 Restaurant CMO vs. Franchise CMO: What's the Difference? Read More
John Gordon 3/17/26 John Gordon 3/17/26 Restaurant Topline is Flat, Margin Outlook Unfavorable Read More
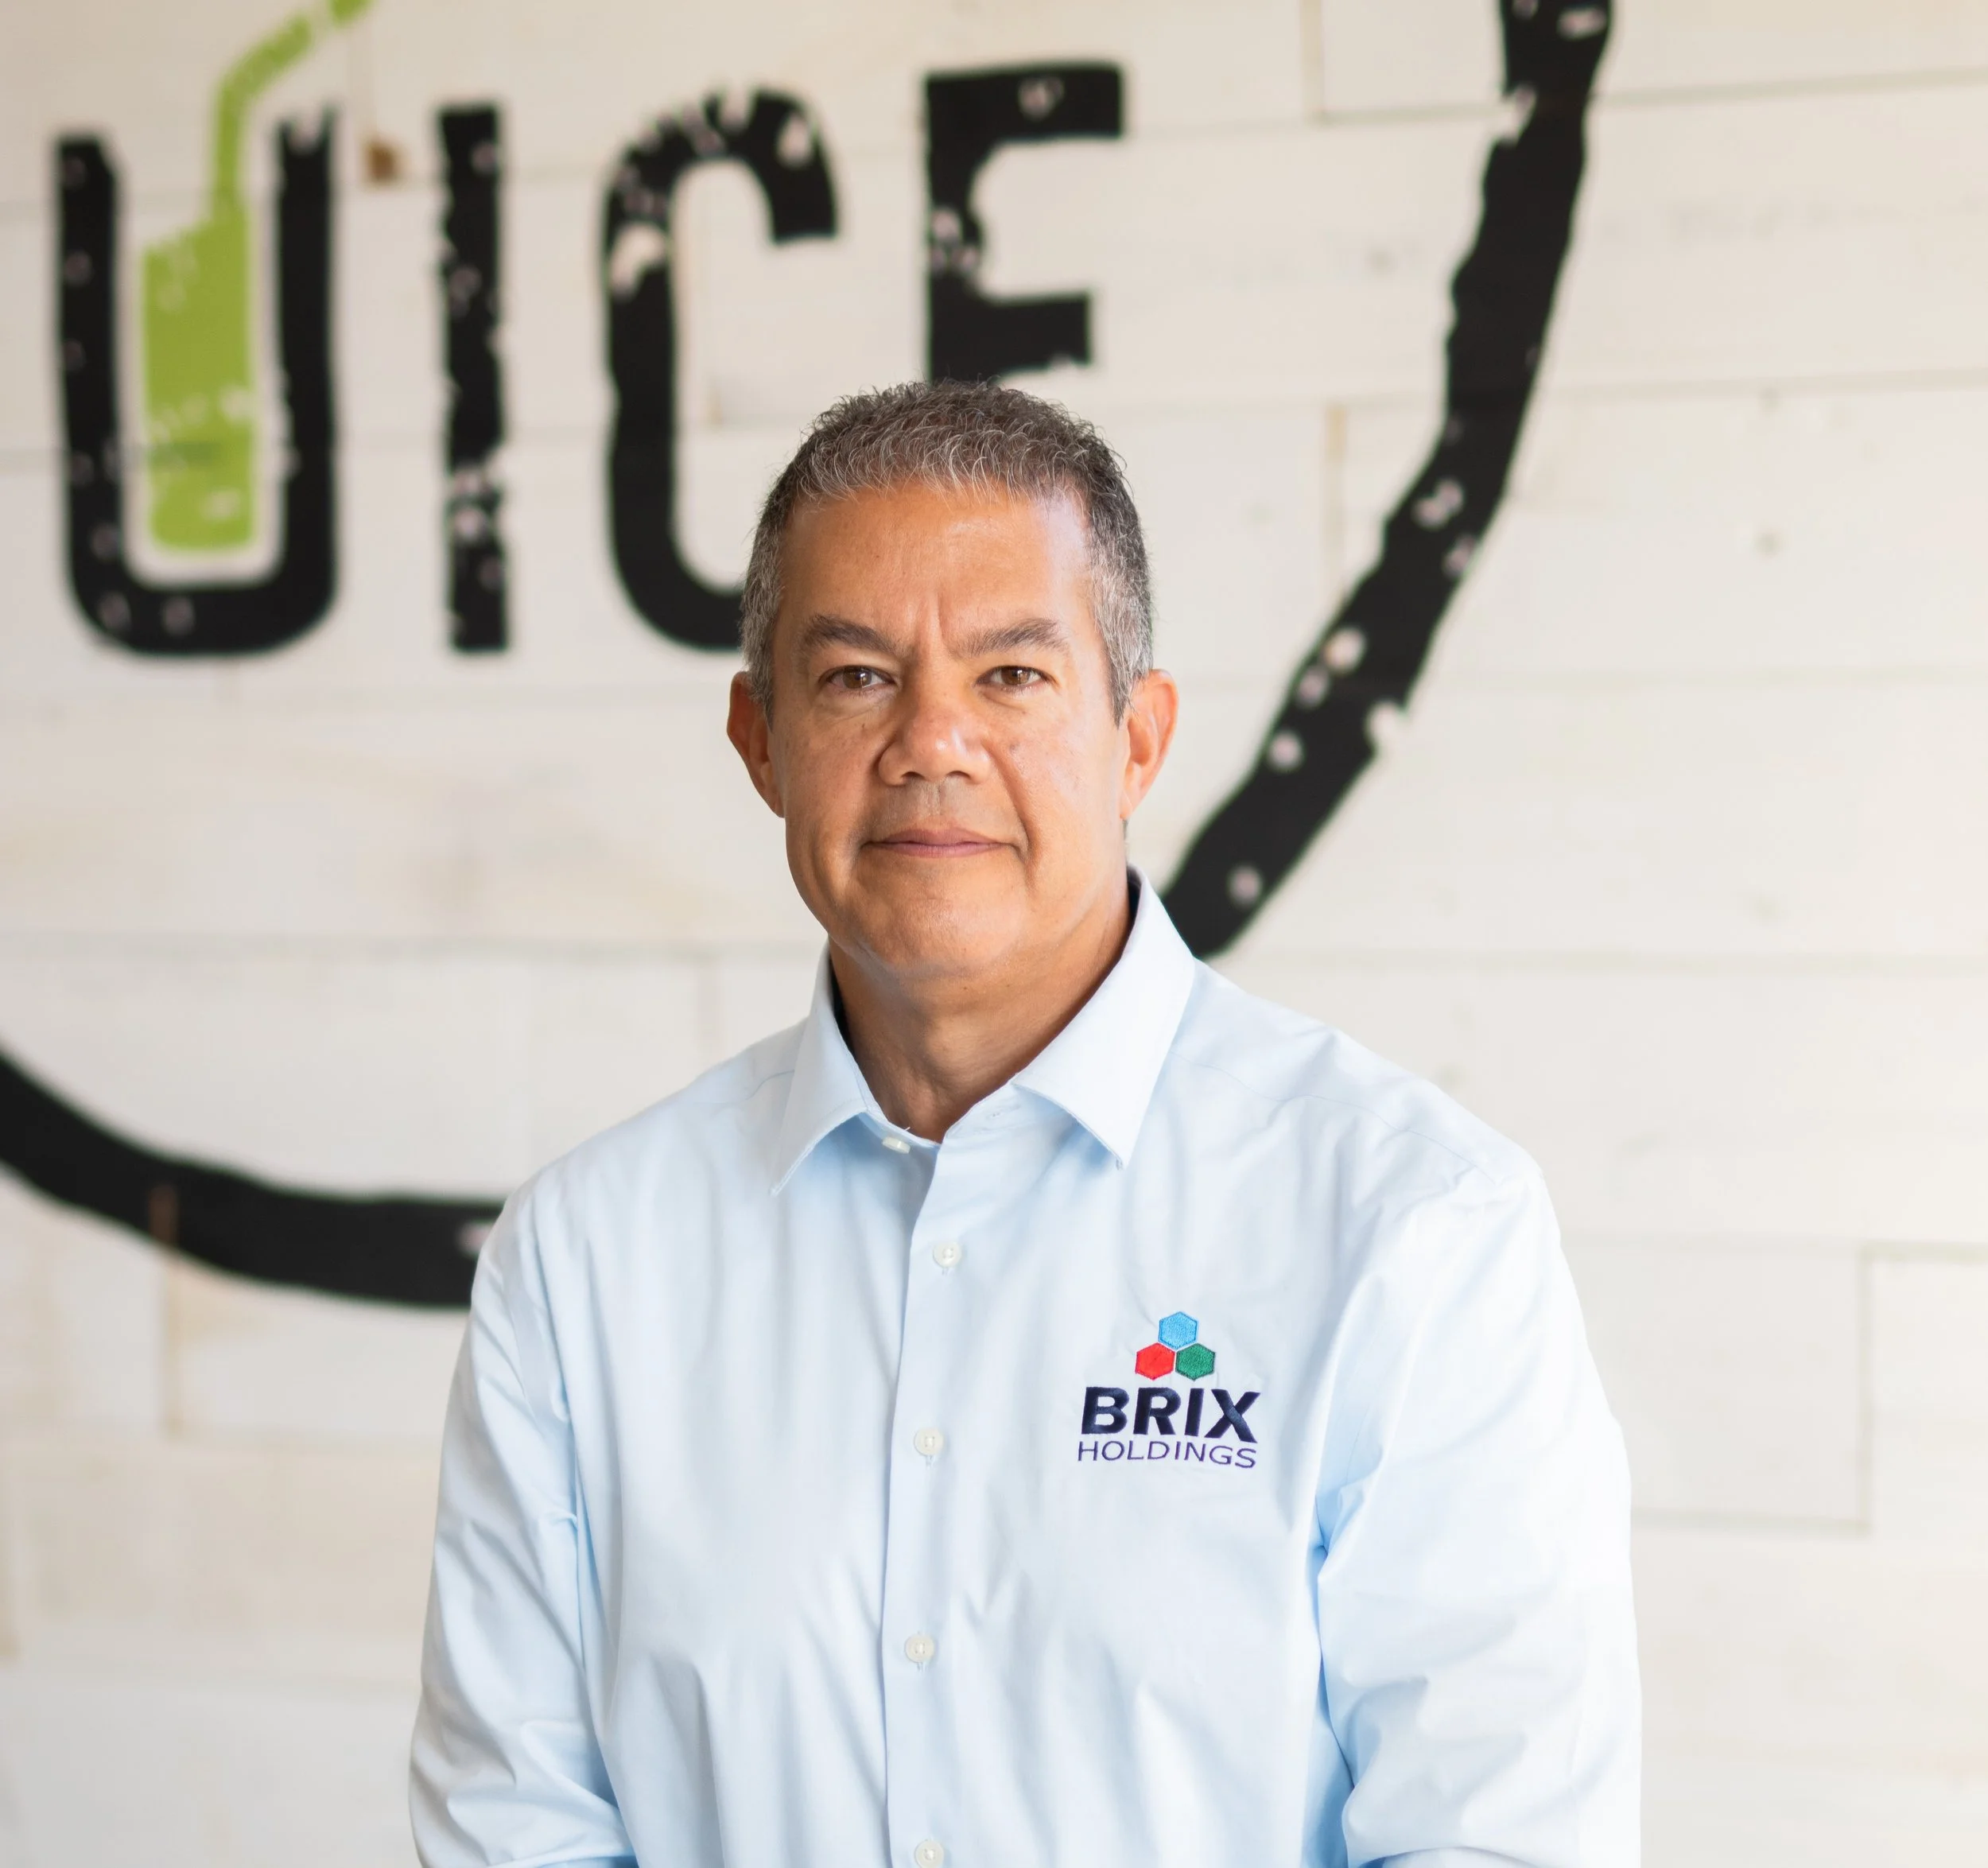
Kevin Stockslager, Managing Partner 3/17/26 Kevin Stockslager, Managing Partner 3/17/26 Corner Office Conversations: Jennifer Dodd, CEO of Main Squeeze Juice Co. Read More
Kevin Stockslager, Managing Partner 3/17/26 Kevin Stockslager, Managing Partner 3/17/26 Financials - March 2026 Read More
Kevin Stockslager, Managing Partner 3/17/26 Kevin Stockslager, Managing Partner 3/17/26 Executive Movements - March 2026 Read More
Mary Rombaut 3/11/26 Mary Rombaut 3/11/26 Franchise Executive Search in Dallas Texas: Finding C-Suite Leaders Who Drive Growth Read More